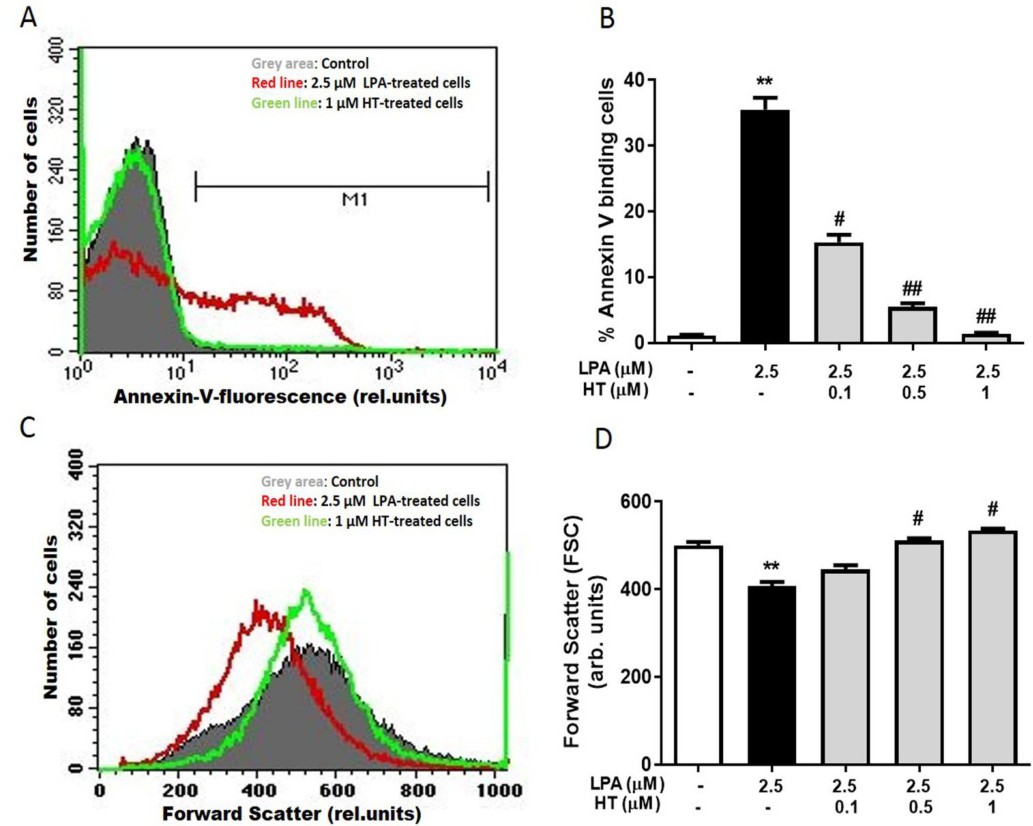
Fig. 2. Effect of HT on LPA-induced PS exposure and cell volume in RBC: Cells were treated with LPA for 24 h in the absence and presence of increasing concentrations of HT. Original histogram of annexin-V-binding (A) and forward scatter (C) of RBC. Arithmetic means ± SEM (n = 8) of annexin-V-binding (B) and forward scatter (D) of RBC. Data are the means ± SEM (n = 8). Statistical significance was calculated by one-way ANOVA followed by Tukey's test. ** (p<0.05) indicates a significant difference from cells lacking LPA treatment. # (p <0.05) and ## (p<0.01) indicate significant differences from cells lacking HT treatment.